These Informative Maps Reveal Surprising Data About the USA
Maps are an invaluable tool for showcasing data and for getting us from place to place. There are a large variety of different types of maps that show us boundaries of territories, elevation differences, weather forecasts, and much more.
For all those interested in the fascinating data maps can portray, this article is for you. Below we have a wide range of maps of the United States that detail everything from the coffee chain most popular in different state to which states have the most student debt. Let’s check out these informative US maps!
1. Late Night Food Runs
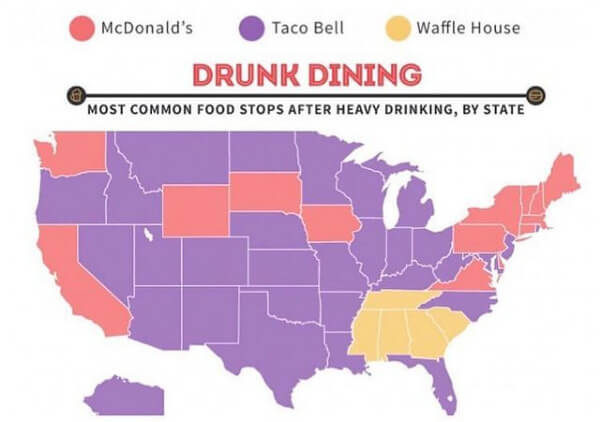
People generally like to get a fast-food fix after a long night of drinking with friends. Who doesn’t want some calories inside their body after expending so much energy? As you can see on the map, Taco Bell won in popularity versus McDonald’s and Waffle House.
Instagram: american_maps
Taco Bell is where the nachos, tacos, burritos, and cheesy jalapeños are waiting. Texas, Florida, and Colorado fully agree on this one. Whereas California and New York would much prefer to munch on McDonald’s hamburgers and fries. If you have opted to go for a classy breakfast favorite, you can join Georgia and Alabama locals at Waffle House.
2. Fresh OJs
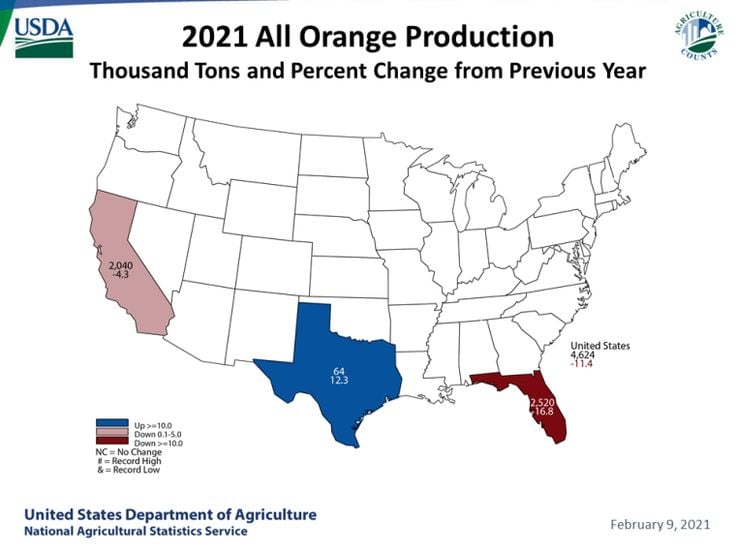
To balance the calories you took in last night, let’s now have some fresh orange juice over ice for breakfast. The continuous rise of orange production in the US is something we should be proud of!
USDA
According to the United States Department of Agriculture, Florida is the one taking care of the Valencia oranges. These are some of the most famous oranges in the US, and most of the orange juice you drink comes from Valencias. California handles most of the orange types that are used for eating rather than juicing.
3. Americanos All Around!
Coffee has been a friend of humanity since around 800 AD. Was it an accidental discovery? Maybe. What we know for sure is that coffee is now a part of people’s daily lives. If you are not in the mood for fresh orange juice, coffee might just do the trick.
Caliper
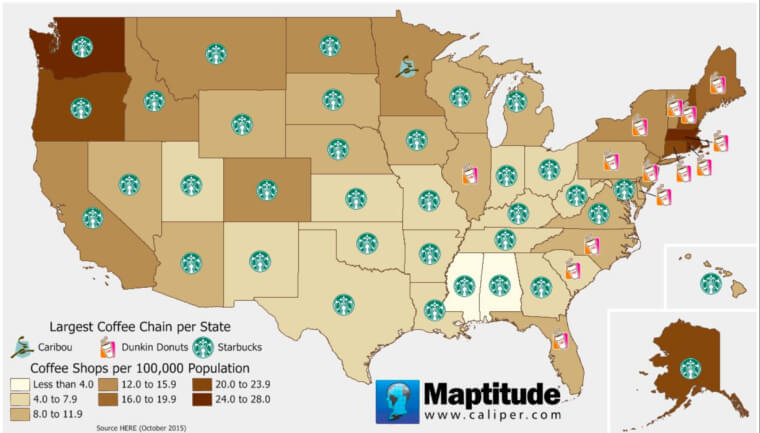
Starbucks holds the record for the largest coffee chain in most of the states. It just proves that a Vanilla Latte or Iced White Chocolate Mocha is a wonderful addition to anyone’s work desk. Dunkin’ on the other hand is most prevalent on the East Coast.
4. Vanilla or Soy Latte?
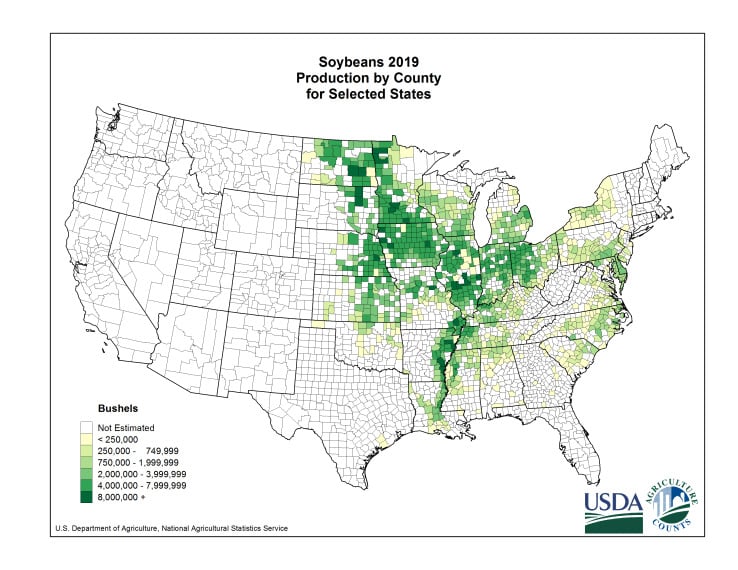
Since we are still talking about coffee, we might as well take a look at where the production of soybeans is flourishing. This map reveals a lot about American agriculture.
USDA
Most of the soybeans come from the central and eastern parts of America. Why is the west coast not invested in soybean production? Surely California, Oregon, and Washington are home to some of the biggest consumers of soy milk. Perhaps it’s a climate thing. We’ll leave it with the experts!
5. Sunnyside Up or Hard Boiled?
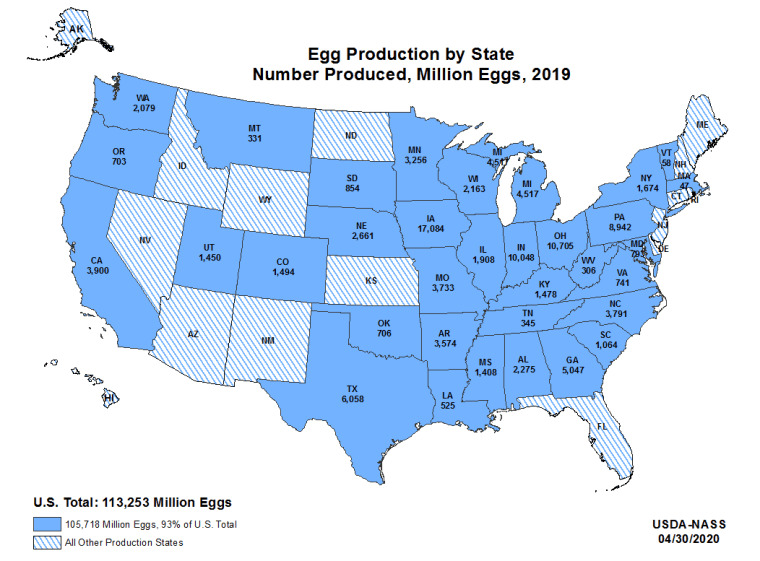
Speaking of breakfast, can a breakfast be complete without eggs? More than 100 million commercial laying hens are producing eggs, with Iowa leading the charge in US egg production.
USDA
Did you know that of more than 200 million cases of eggs produced in 2020, over half were sold through retail stores while more than a quarter were further processed into food products? The utilization of eggs is something else!
6. A Tree Starts with a Humble Seed
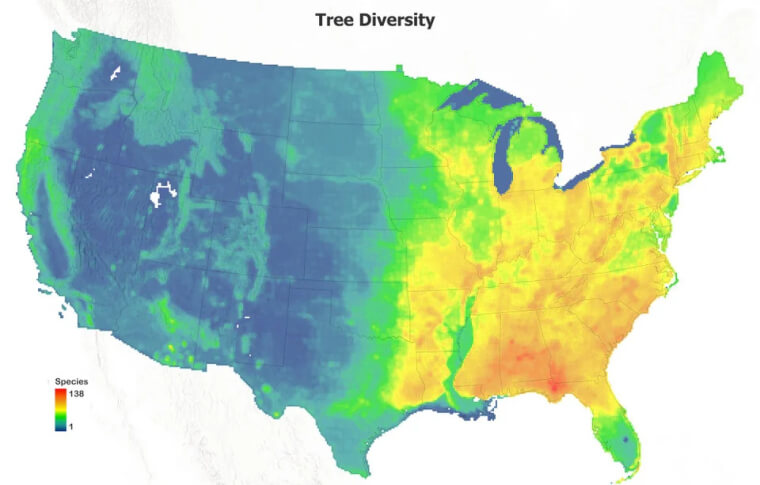
Diversity doesn’t just apply to people. It is also applied to trees. Liberty County in Florida has the highest tree species richness, containing many different species. Many of the blue spots are accounted for by deserts, plains, and lakes.
Reddit: u/Van_ae
The eastern part of the USA seems to have a large population of different trees as it has the most diverse tree population. Tree enthusiasts and foresters would love to visit there. However, don’t lose hope, if you are located on the western side of the map, you can still find different species for sure!
7. If a Tree Falls in the Forest...
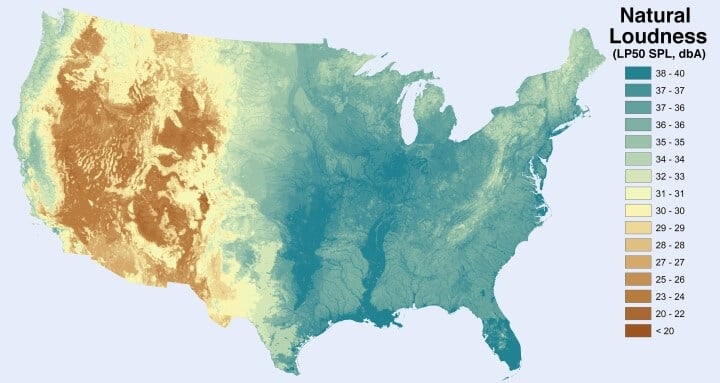
They say that you will find peace and calm in the forest, but it still makes noise. Indeed, as the famous Chinese proverbs say, “a falling tree makes more noise than a growing forest.”
National Park Services
The eastern part of America is louder than the west coast, maybe because of the trees that are found there. As researchers have said, it is most likely because of the water as well. A corridor along the Mississippi River stands out, as does the whole of South Florida. As Dr. Daniel Mennitt, a certified Occupational Hearing Conservationist said, “sound is life.”
8. The Sound of Silence
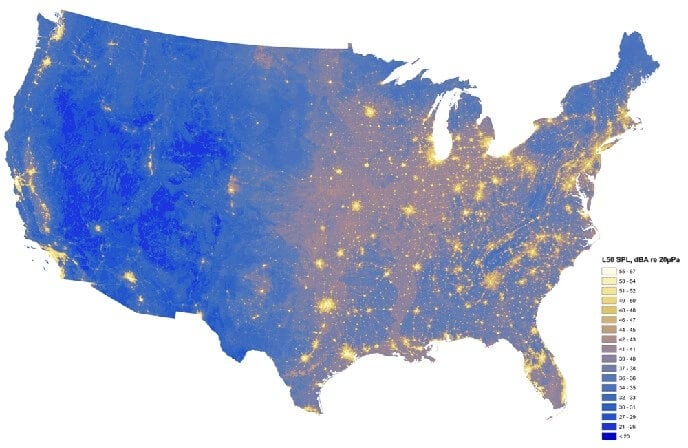
We’re already familiar with the east coast being the loudest in terms of natural noise. Now in this map, we’re going to explore where most of the human-related noise pollution comes from.
National Park Services
Denali and Yellowstone on the west coast are aircraft traffic zones, but this only tends to raise their noise levels by around 5 decibels. It is no surprise that Los Angeles, San Francisco, and New York produce a lot more noise. There’s a reason New York City is known as “the city that never sleeps.”
9. Good Food Choices
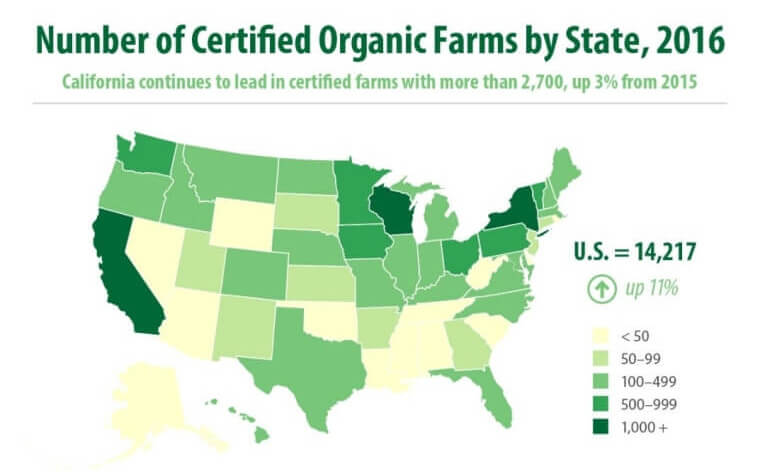
According to data from the US Department of Agriculture, there were more than 14,000 certified organic farms in 2016. When you think about it, that’s a lot. Now the question is, are you included in those people who purchase organic food?
USDA
California still has the crown when it comes to the number of organic farms. However, other states are demonstrating growth in organic farming. The reason organic foods are a little more costly is that more effort and expense goes into taking care of the plants without using chemical fertilizers, pesticides, or fungicides. Organic certification doesn’t come cheap either.
10. America’s Burger Urges
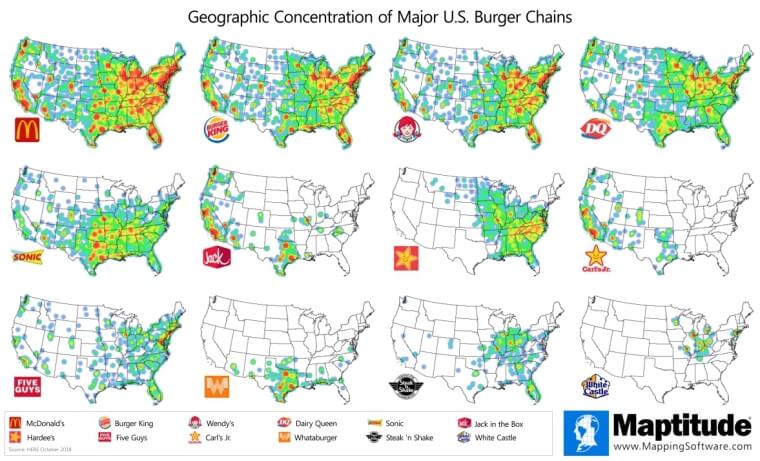
We know that it takes a lot of effort to go green, but it doesn’t hurt to satisfy those burger urges every now and then, right? So long as you don’t make a habit of it, a burger here and there is a great treat.
Caliper
McDonald’s is still number 1, with 14,000 restaurants nationwide. Whereas Burger King, Wendy’s, Dairy Queen, and Sonic all have over 3,000 establishments. Steak n’ Shake and White Castle may need to make their presence known on the west coast to catch up.
11. Soda Pop Culture
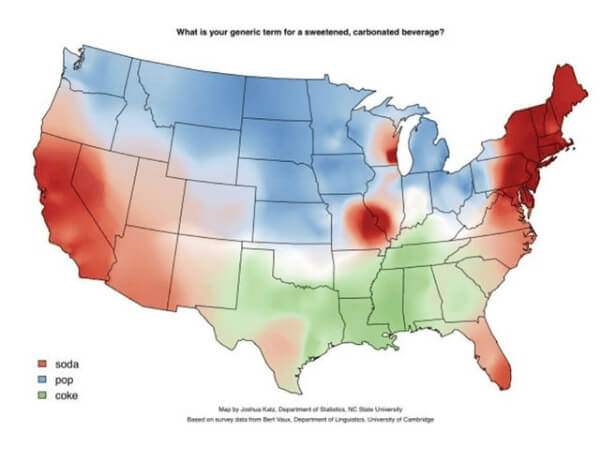
A fast-food meal is not complete without a fresh, ice drink, and what is the usual partner of burgers and fries? Of course, it’s the sweetened, carbonated beverage. However, the generic term differs in America, depending on where you are.
Instagram: mapsoftheus
New Yorkers are more comfortable with using “soda” as the generic term. Northern peeps are used to “pop,” while many of the southern states are more into “coke.” This map is useful if you have a vacation coming up. You can now be considerate and use the local term.
12. Time for Thanksgiving!
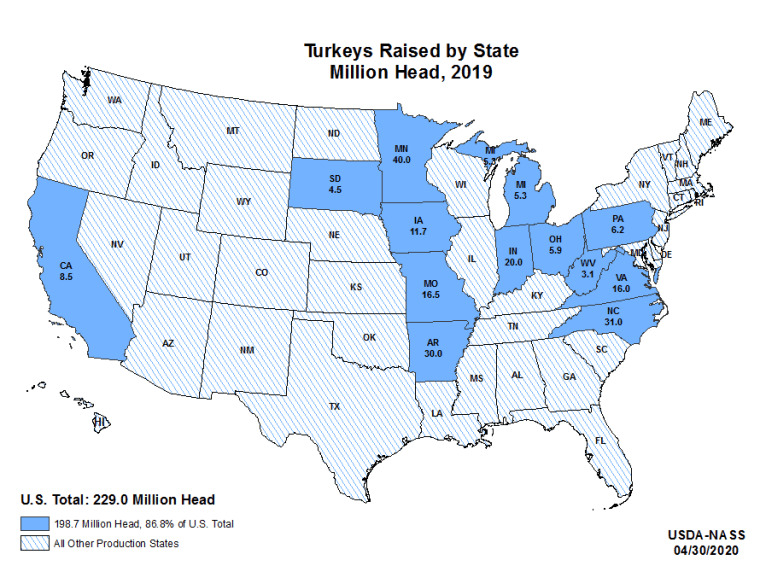
A thanksgiving celebration is not complete without a turkey on the table. In our minds, it is essential to have a turkey seasoned with salt and pepper, rosemary, and maybe some butter and lemon. What’s your favorite turkey seasoning?
USDA
It takes a lot of work to raise a good turkey to sell before Thanksgiving. This is why farmers from the eastern part of the USA work hard to ensure that a plump and juicy turkey can be enjoyed by each family.
13. Shake It Off
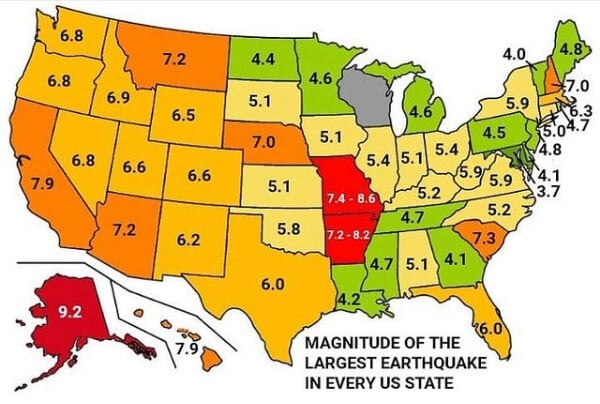
Do earthquakes happen everywhere in the United States? This map offers proof that they have happened at least once in almost every state. However, the magnitudes differ greatly. Earthquakes are prominent on the west coast, which is otherwise known to be relatively temperate and comfortable.
Instagram: american_maps
West coast states usually experience earthquakes with 6.0 magnitude and up, and it is no joke. Alaska experienced the largest earthquake in the whole of America, with a magnitude of 9.2. How strange is it, though, that Wisconsin is the only states that has never experienced an earthquake?
14. Not About the Money, Honey
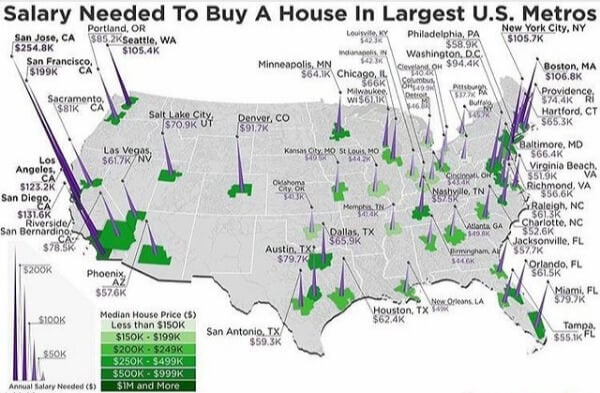
It is a big decision if you want to invest in a home, especially if you have a mortgage and will have to rely heavily on the regularity of your paycheck. Be reminded that real estate markets vary from place to place.
Instagram: american_maps
Is it a shock to someone living in the US that two big Silicon Valley cities – San Jose and San Francisco – top this list? You need to earn a lot to be able to afford your place. On the other side, Pittsburgh is the most affordable city, followed by Cleveland and Oklahoma City.
15. You Are Not Alone
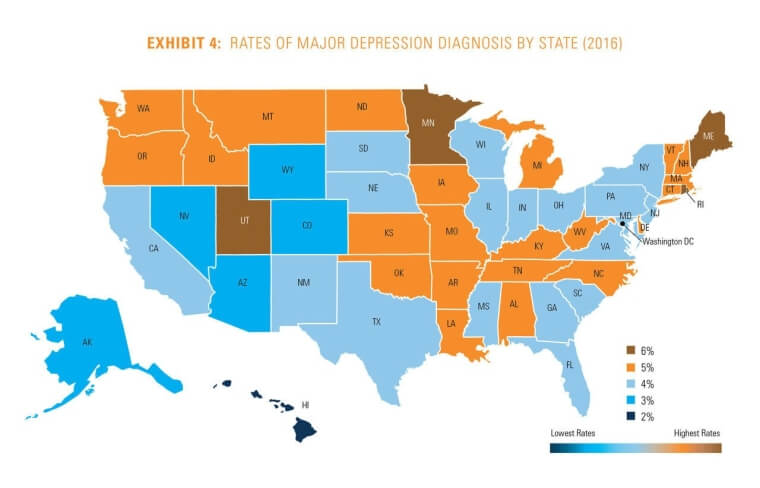
According to the American Psychiatric Association, depression is a common and serious medical illness that can negatively affect almost every aspect of your life. It can affect anyone, whether a child or an adult. This map shows which states are affected the most.
Reddit: u/thow78
The highest rate of depression can be found in Maine, Minnesota, and Utah at about 6%. Whereas, the lowest rate can be found in Hawaii with 2%. One of the most common factors for a person to have depression is the excessive use of cell phones. In a study, it has been found that teens often develop depression due to the use of social media which affects their self-esteem.
16. Student Debt Distribution
Graduating college is an exciting time… until you realize how much debt you now have to repay. It is common to celebrate when you graduate college, but in a way, what you are celebrating is the start of paying off your debts.

Instagram: american_maps
According to the data of the Institute of College Access and Success, there are approximately 45 million Americans who have student loan debt, with New Hampshire holding the highest average student loan debt at over $36,000 per loan. On the other end of the spectrum, Utah was the state with the lowest average student debt, with graduates only owing around $19,000.
17. People in Need
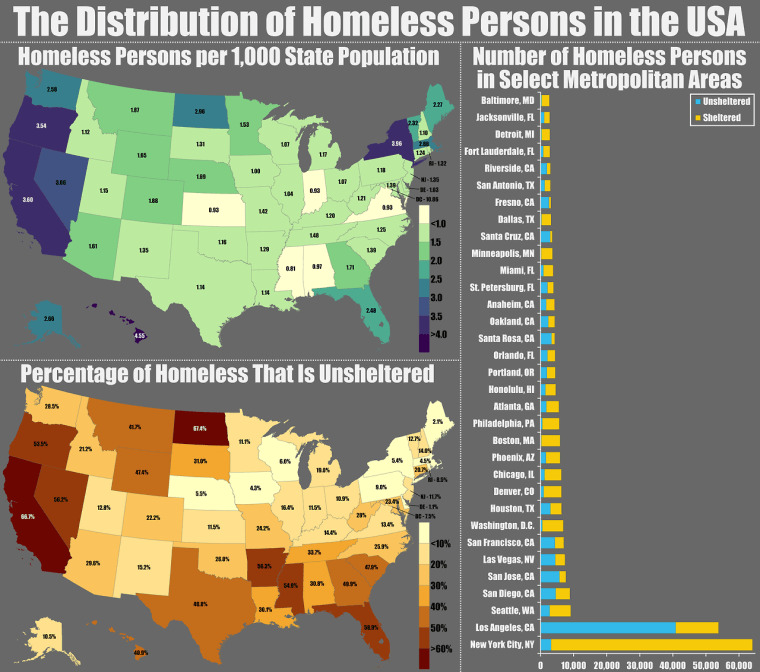
At some point in our lives, we’ve all seen a homeless person in the street. Most of us have given a few dollars, either in person or via charitable organizations, but still felt helpless and as though our contributions are a mere drop in the ocean.
Reddit: u/ragggaerat
Los Angeles, California, and New York City topped the list with almost 50,000 and 60,000 homeless people respectively. Imagine their situation, especially on winter nights. This is something the country needs to address more.
18. Heavy Load
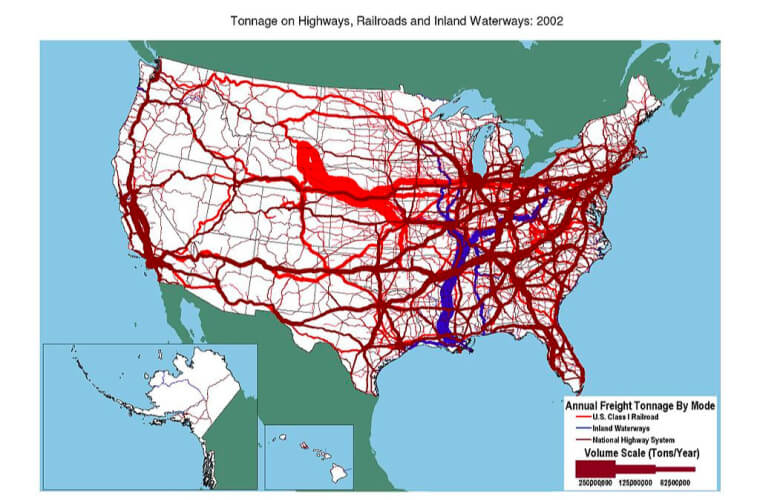
Freight is merchandise or materials that are being moved by vehicles such as trains, airplanes, trucks, or ships. It affects the economy of each country as we depend on freight transportation to connect businesses to markets across the world. In the US, freight lines are like the arteries that keep the country alive.
Kcida10 via Wikipedia
Both the west coast and east coast rely on their national highway systems, while the middle part of the USA is reliant on the railroad system. Inland waterways handle some freight traffic too. Whatever transportation method a business may use, it will surely get to its intended destination thanks to the robust system you see on the map above.
19. Ancient Acquisitions
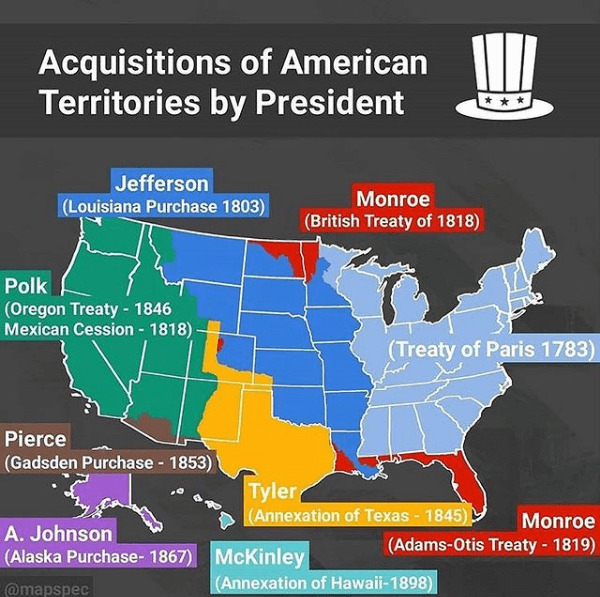
Many former presidents of the United States used their power to acquire territories and mark their legacies. It is because of them that the US map is filled with all the states we have today.
Instagram: american_maps
Thomas Jefferson negotiated the Louisiana Purchase which began the trend of Westward Expansion. The British Treaty of 1818 was signed during Monroe’s first term as president which started the border between the Canadian and US territories. And many other treaties would follow in order to shape the United States we know today.
20. Let’s Go Hiking!
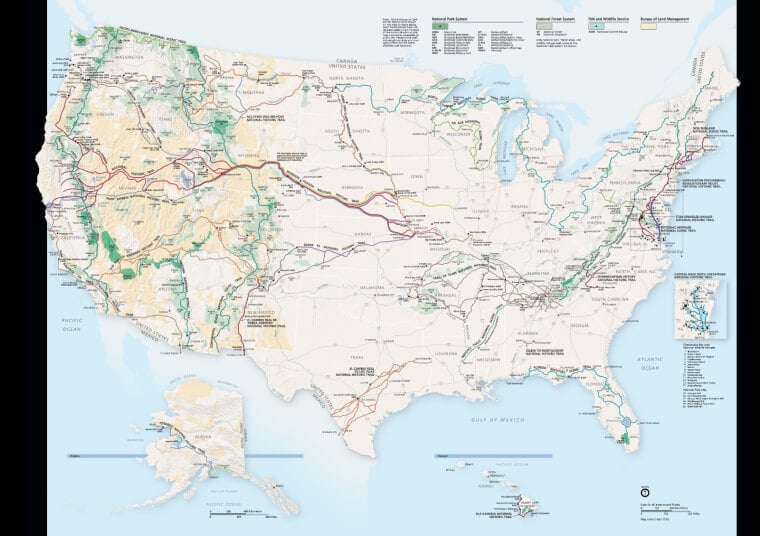
One of the most enjoyable hobbies before and during the pandemic was hiking. America’s landscape is extensive, and you have a lot to explore. As restrictions lift and we adapt to post-pandemic life, more and more people are turning to nature for their health and wellness.
National Parks Services
If you are a new hiker, worry not as the Lassen Peak Trail Hike is ideal. You can start there, and if hiking makes you happy, try other trails such as the Pacific Crest Trail, The Appalachian Trail, and the Continental Divide Trail. These three are the major hiking trails in the US, and if you manage to finish all of them, you should be proud of yourself!
21. Beep Beep!
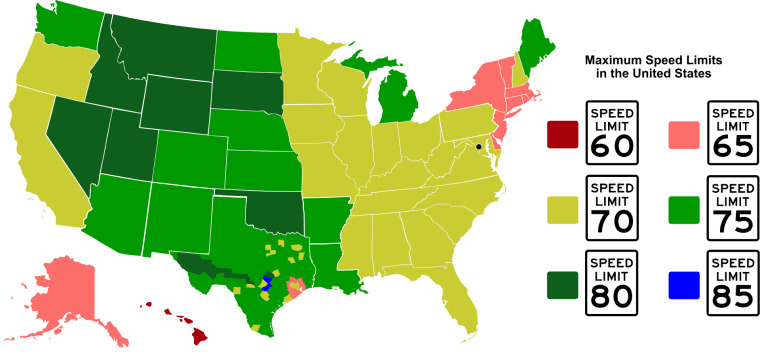
Driving is de-stressing for some people. For others, it is their responsibility and job. However, Americans should take note of the speed limit in each state. This is just as important for safety as it is for avoiding the state troopers!
IIHS Via Wikipedia
In most areas, 75-80 mph is the speed limit, while others are good with 70. There is one little area that allows up to 85 mph. Be sure to be mindful of your surroundings at all times. You may be happily driving at 85 mph, and then in a snap, you’re back in the 75 mph area.
22. Connecting States
The National Highway Services is a network of major roads within the United States. It connects the whole of America with the use of strategically placed highways that can take you almost anywhere you wish to go.
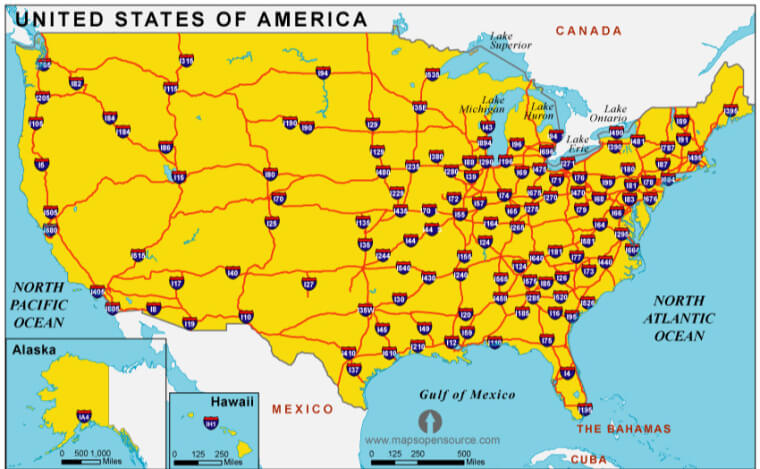
Maps Open Source
Looking at the map, it is possible to cruise around America in your Ford F-150. Again, just be mindful of the speed limit in every area so you can fully enjoy your cross-country road trip.
23. The 7 Deadly Sins
It’s hard to resist temptation when it involves something that you desperately want to do. It’s wild to learn that someone has put this much effort into studying the sinful things that every state likes to indulge in.
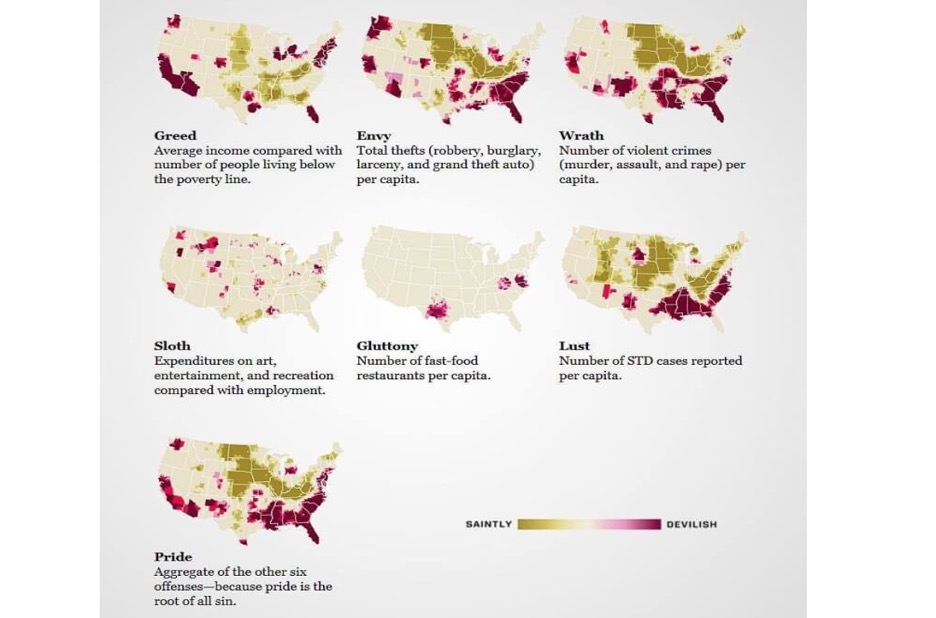
Reddit: u/ParadoxicalCabbage
Florida has a devilish side as it is high in pride, wrath, envy, and greed. North and South Dakota, by contrast, are more on the saintly side.
24. Sporty Nation
Security, health care benefits, and retirement benefits are some of the reasons why it is enticing to work in the public sector.
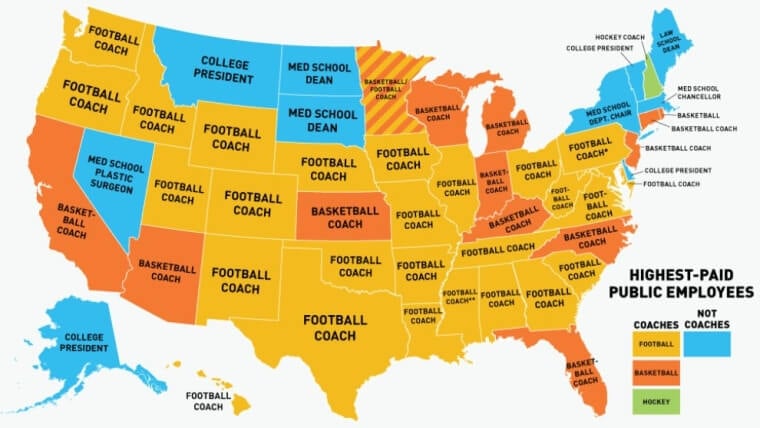
Twitter: @ManuscriptMaps
As you can see on the map, most of the highest-paid public employees seem to be sports coaches. Football coach and basketball coach top the list. Most of them can have a salary of almost $1 Million. It can be higher, depending on the performance of the teams that they are coaching.
25. Cold Summer Nights?
Do you ever wonder how the Alaskan schools view the map of the United States? In the great northern state, the rest of the country is thrown into the box normally reserved for Alaska. At least for the Alaskan schools, they are the star.
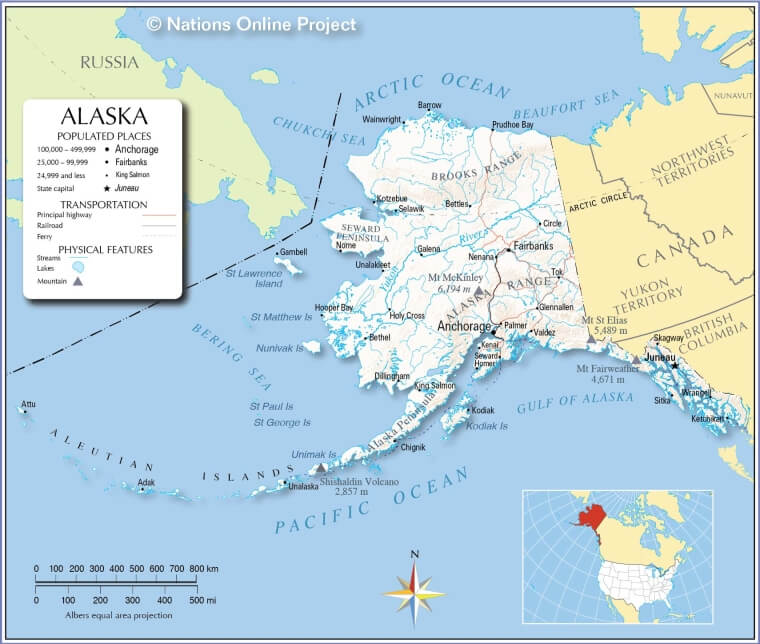
Nations Online
It is nice to know that on some maps of America, Alaska gets to be the star of the show, rather than appearing in a tiny box like an afterthought.
26. Underneath the Christmas Tree
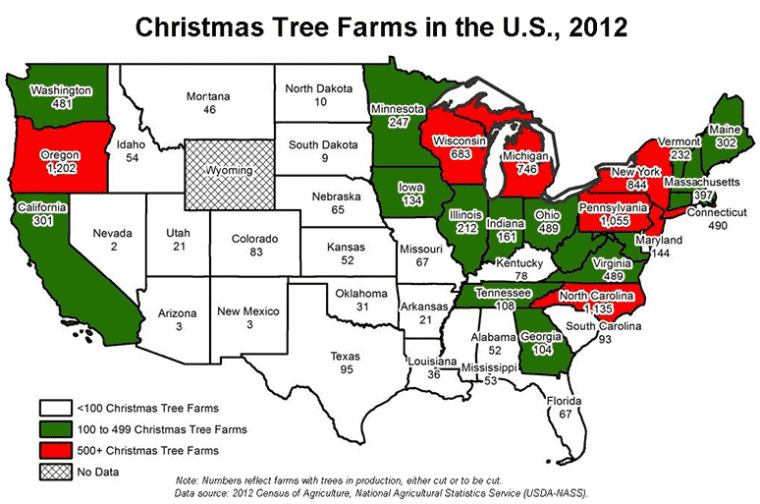
December, winter, and Christmas are just around the corner, and the holiday season is not complete without food, family, gifts, and of course, a beautiful Christmas Tree.
USDA
It’s probably best to shop for your Christmas trees in those states with more than 500+ Christmas Tree farms. For sure, you will have a lot of options to choose from. For some reason, Wyoming refuses to share its Christmas tree data.
27. Room for Rent
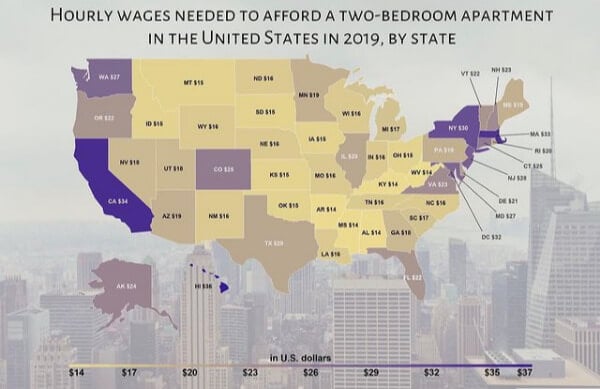
New York and California are the first two choices in living the American Dream, but the question is, can your hourly wage support it? This map is an excellent reference to help you determine the best state to settle down in.
Instagram: american_maps
As a starter, consider renting in Arkansas, South Dakota, and Idaho. As you move up in your career and your paycheck increases, you may wish to go to California or New York. One step at a time – that’s the way to get ahead!
28. The American Dream
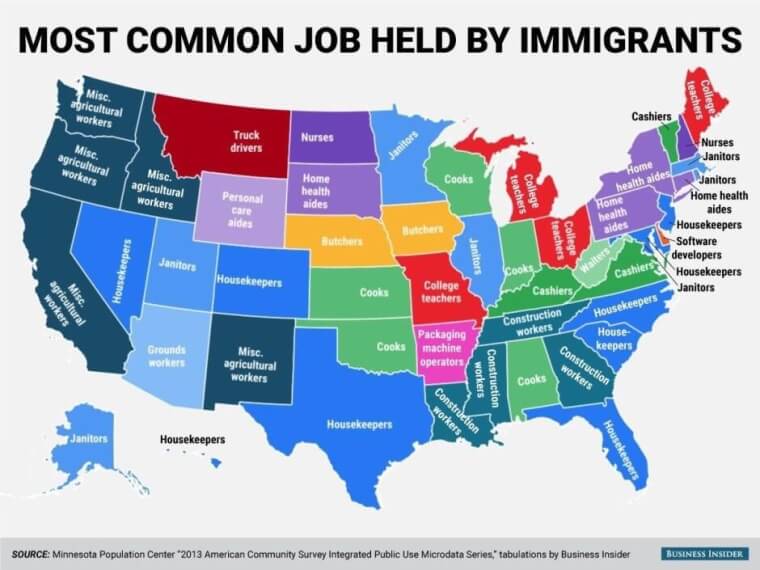
Speaking of the American Dream, there are a lot of dreamers who want to settle in America, and they know clearly that this won’t be easy as they will need to work in whatever field will take them, regardless of whether the job is fulfilling or not.
Twitter: @simongerman600
Most of the map features blue-collar jobs. However, there are some states that gladly accept nurses and college teachers from other countries. Wherever you start, it can be a stepping stone to the job of your dreams.
29. Firearm Density
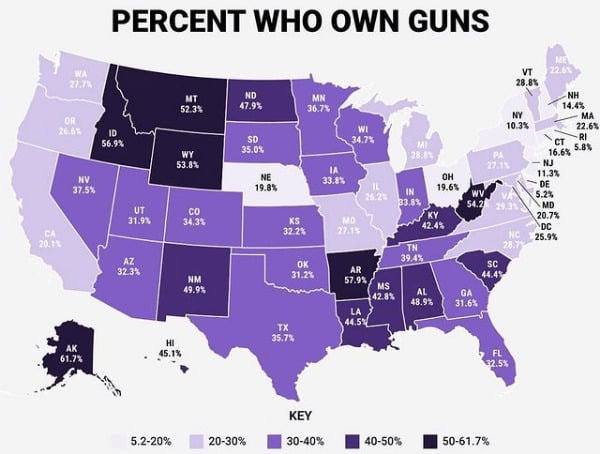
According to statistics recorded in 2017, there have been approximately 42,000 incidents involving gun violence. Among these incidents, an alarming number were mass shootings.
Instagram: mapsoftheus
It is not a surprise that a lot of American people own guns as they want to exercise and maximize their Second Amendment Rights. The question is, how many Americans use their guns appropriately? If you are afraid of guns, maybe try to stay away from Arkansas, Idaho, and Montana.
30. “Do You Like Scary Movies?”
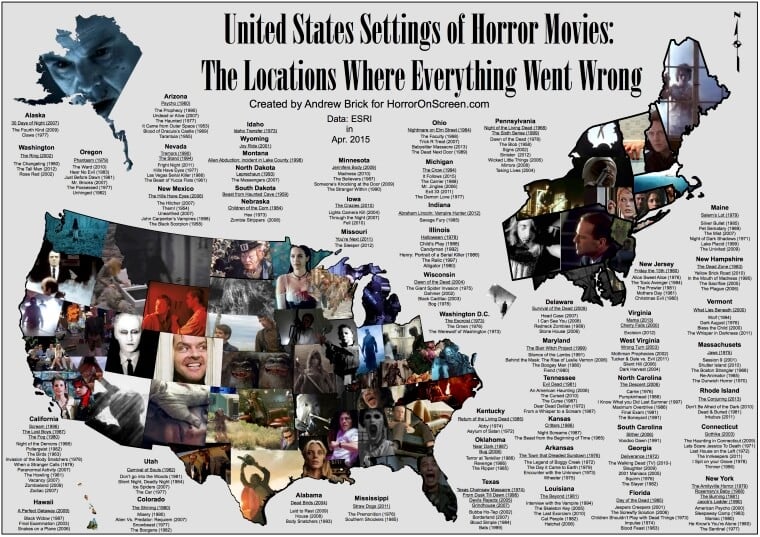
The United States is filled with beauty, and it has also been the setting for many famous TV shows and movies. This map shows the famous horror movies and their settings in each state. If you want, you can use this map to take a horror road trip through the US.
Reddit: u/scouserdave
If you are a movie buff with a soft spot for horror movies, you can have a vacation in each state and head out to explore the spots where they shot these famous flicks. Just make sure you stay safe!
31. The Story of the Cold War In Map Form
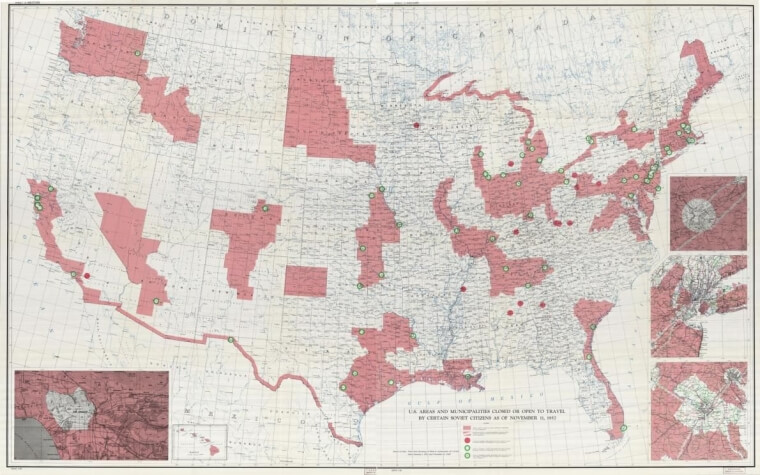
The cold war started in 1947 and didn’t end until 1991. This was a period of political tension between the United States and the Soviet Union that developed in the wake of World War II.
Twitter: @simongerman600
The red regions on the map signify the places where Soviets citizens were not allowed to go. The Cold War brought about so many changes in terms of the political hierarchy of America. A lot of things happened, and the economy and the personal lives of Americans have been permanently affected by this war.
32. Prison Break
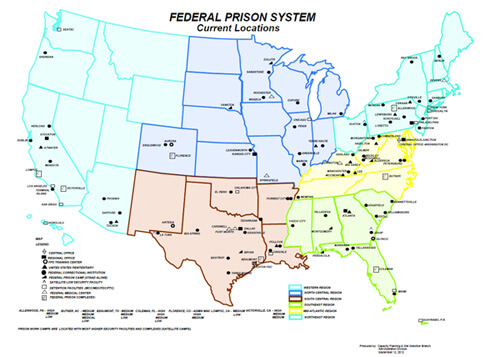
Different states have different laws, and then there are overarching federal laws as well. Because of this, you will find different federal prisons scattered across the country, housing those who have breached the law.
US Department o Justice
According to data, the Bureau of Prisons has 109 prisons, along with additional correctional facilities. If you look at the map, you can see all the different types of facilities that are present within each state.
33. Love-Hate Relationship
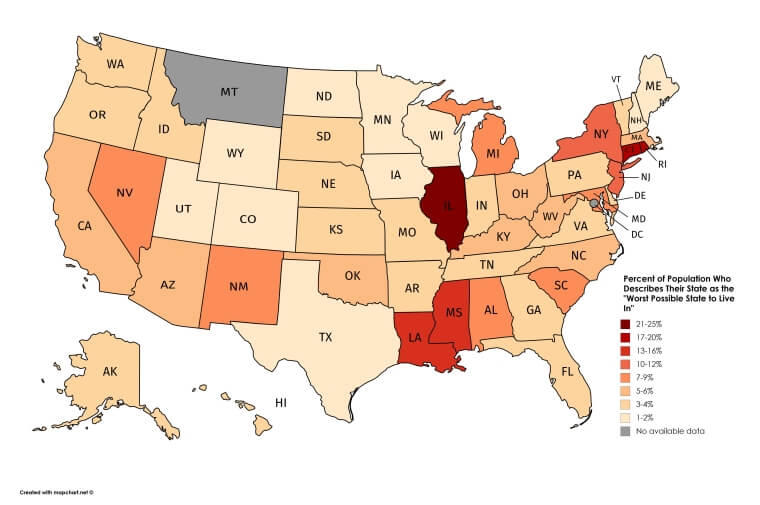
It is no surprise that there are some days we hate the place we live. However, it seems that many people do not want to let go of that place because they have a love-hate attachment to it.
Twitter: @simongerman600
Illinois tops this list with more than 21-25% of its population being deeply unimpressed by the living conditions in the state. The people of Montana seem to love their state so much that they didn’t even bother responding to the survey. How sweet!
34. The Origin of Life
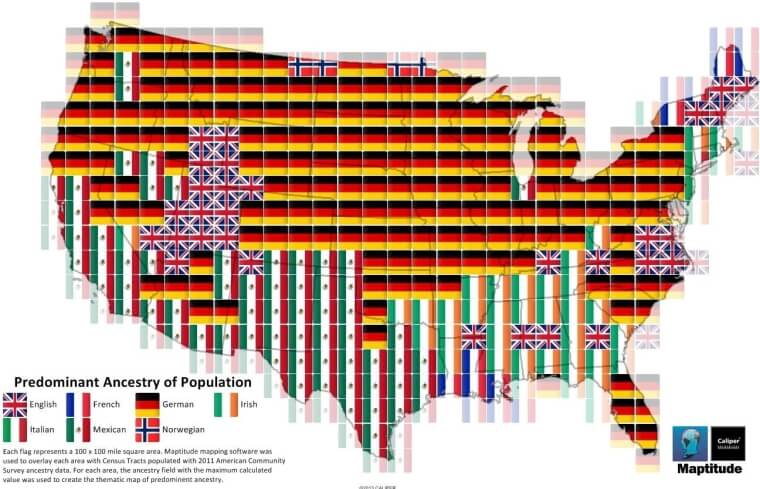
These days, it is possible to check your ancestry with the use of DNA testing that can be initiated through certain websites. If you don’t want to pay the fees, this map can give you a general idea of your ancestral mix.
Twitter: @DNA_RNA_Uni
It has been said that America is where different cultures from across the globe meet, but it seems the people of Germany make up the biggest part of it. You can see the proof written all over this map.
35. State Names
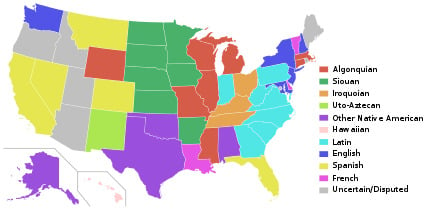
Speaking of our ancestry, do you have any idea where your state name came from? It’s awesome to take note that even in its state names, America diversified. Many come from native languages, while there are quite a few that come from the languages of settlers.
Wikipedia/Ixnay1
It’s so interesting to see the cultural spread reflected in the way the name of each state was acquired. We do wonder though about the origin of Oregon and the names of the other disputed states.
36. Counting People
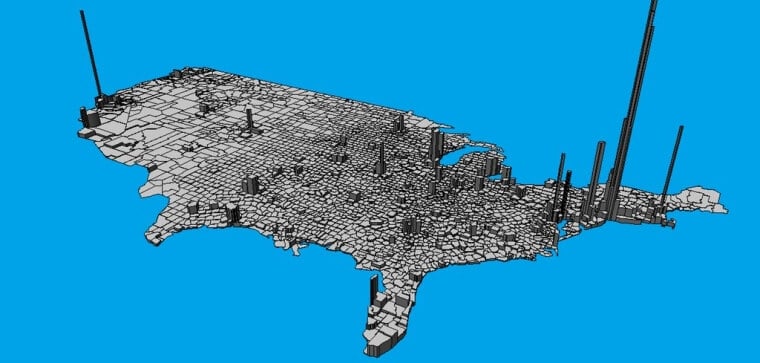
It’s not surprising to know that the population of New York and California are higher compared to other states. These towers are such an interesting way of reflecting population density. Indeed, they reflect the high rises that often spring up in highly populated areas.
Twitter: @simongerman600
A lot of immigrants to America have settled in these two states over the years, and they continue to call out to new arrivals. New York and California have the opportunities people crave, promising the possibility of achieving impossible dreams.
37. Life Expectancy
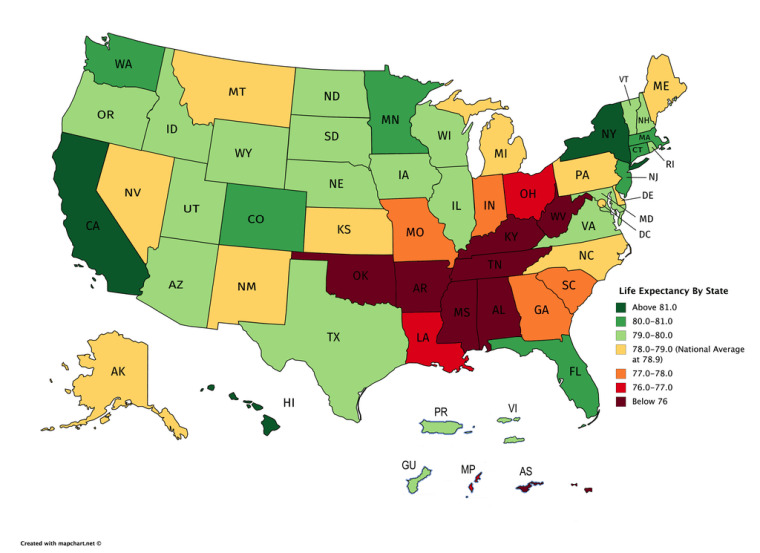
Life is beautiful when you make the most of it. That is why some people work hard to live their lives well and prosper for as long as they can. This map shows the distribution of life expectancy throughout the states.
Spooderman89 via Wikipedia
Since California is one of the biggest producers of oranges and organic food, it is no shock that they have the highest life expectancy rate. Currently, it is above 81 years old. Eating healthy food is clearly worth it!
38. How Land Is Distributed
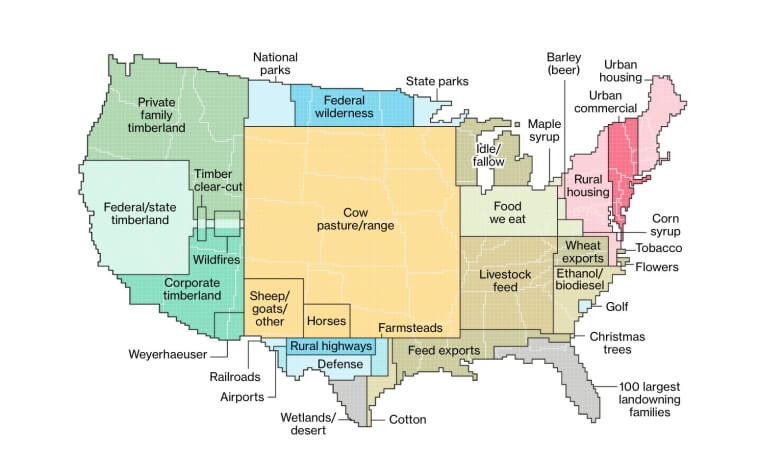
Different states have different products to offer, just like restaurants have different specialties. However, nature does not stick to our boundary lines. We can see on this map what all the US regions have to offer.
Twitter: @LegalHeat
In the center of the country, there is a large land distribution that is ideal for cow farming and pastures. The west coast is all about forests, while the north promises wilderness and beautiful national parks.
39. Families at Home
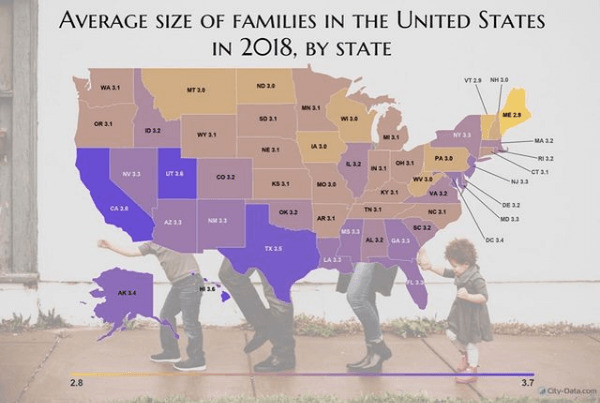
Though some states clearly favor larger family sizes than others, this map shows that the averages aren’t that far apart. It seems most American families hover around the 3-member mark.
Instagram: american_maps
The US Census Bureau defines “family” as a group of people related by marriage, birth, or adoption who reside together. Any cohabiting relatives are considered part of the family. The map shows that the state of Texas has the most expansive family sizes, with an average of 3.5 persons in each Texan family.
The Biggest Employers in Every State
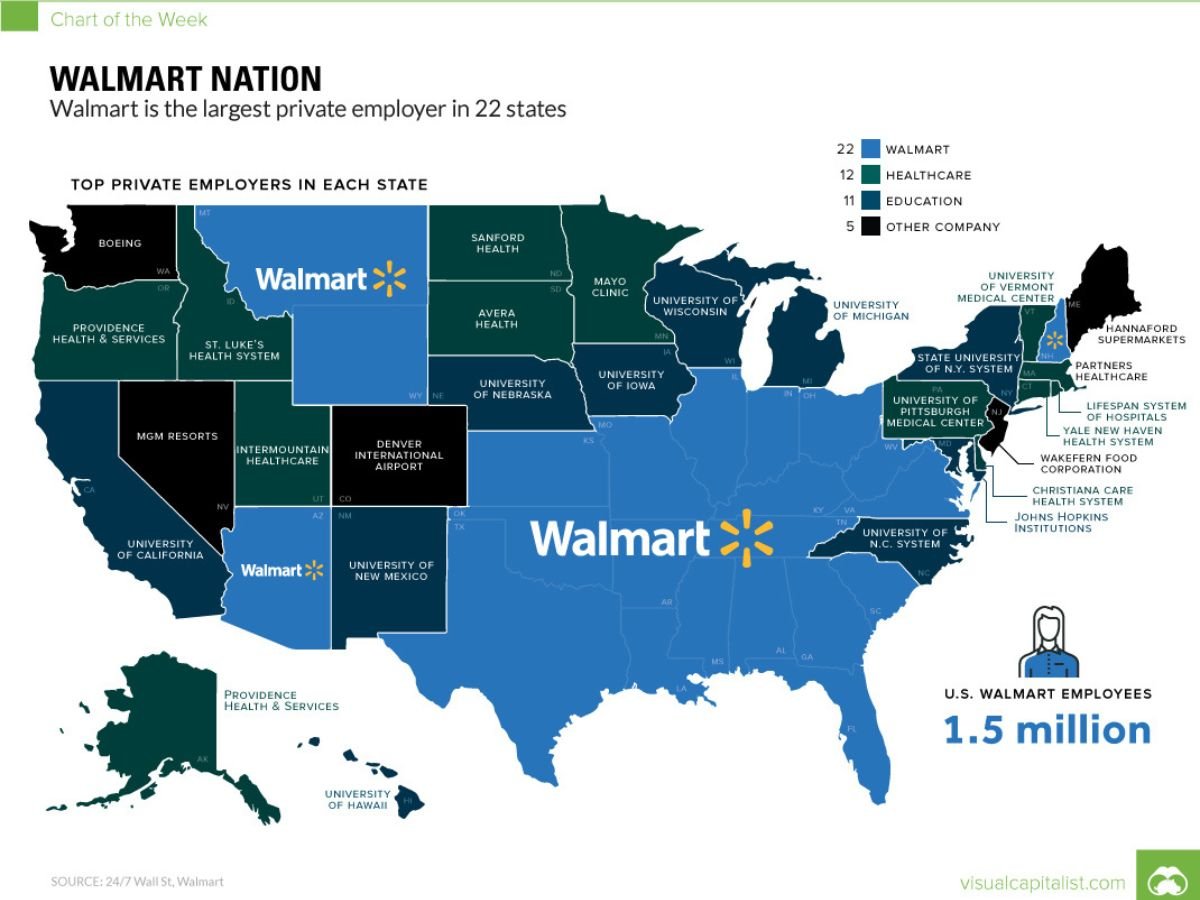
The largest companies in America operate on a very large scale, and this map that highlights the biggest employers in every state proves that. The map shows that the largest companies are mostly healthcare companies, universities, and… Walmart.
Source: Incubator.org
According to the map, Walmart takes the cake for being the largest employer in most of the states in the Southeast with 1.5 million employees nationwide. If you’re on the hunt for a job, likely try Walmart first!
Lowest Recorded Temperatures
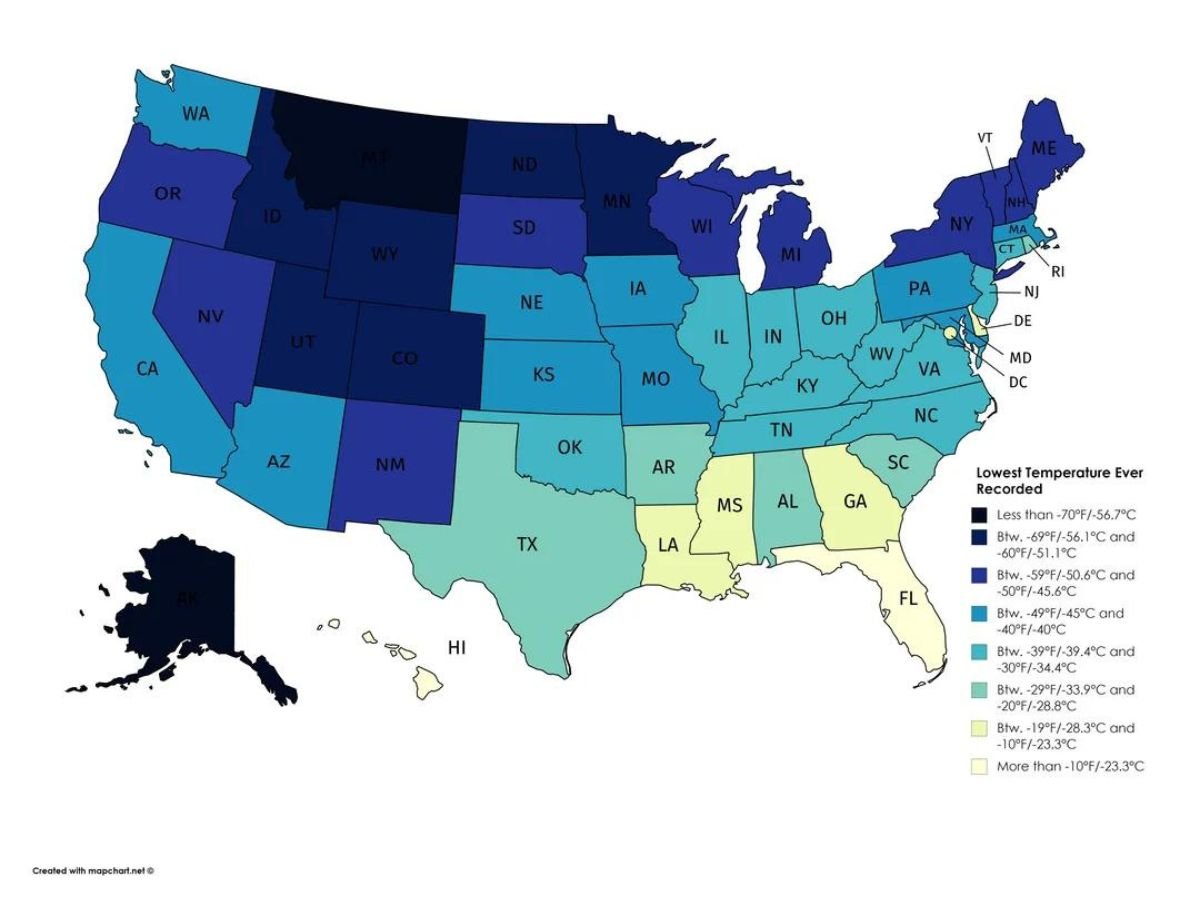
The United States sees some diverse temperatures throughout the years, especially some crazy cold weather. If you were wondering what the absolute lowest temperatures each state has experienced, this map will show you.
Source: @dataisbeautiful/ Reddit
Montana and Alaska have had temperatures less than -70℉/-56.7℃, while Florida is lucky enough to have never seen the temperature get below -10℉/-23.3. If you don’t like the cold, make sure to stay South!
Percentage of Households with a Computer
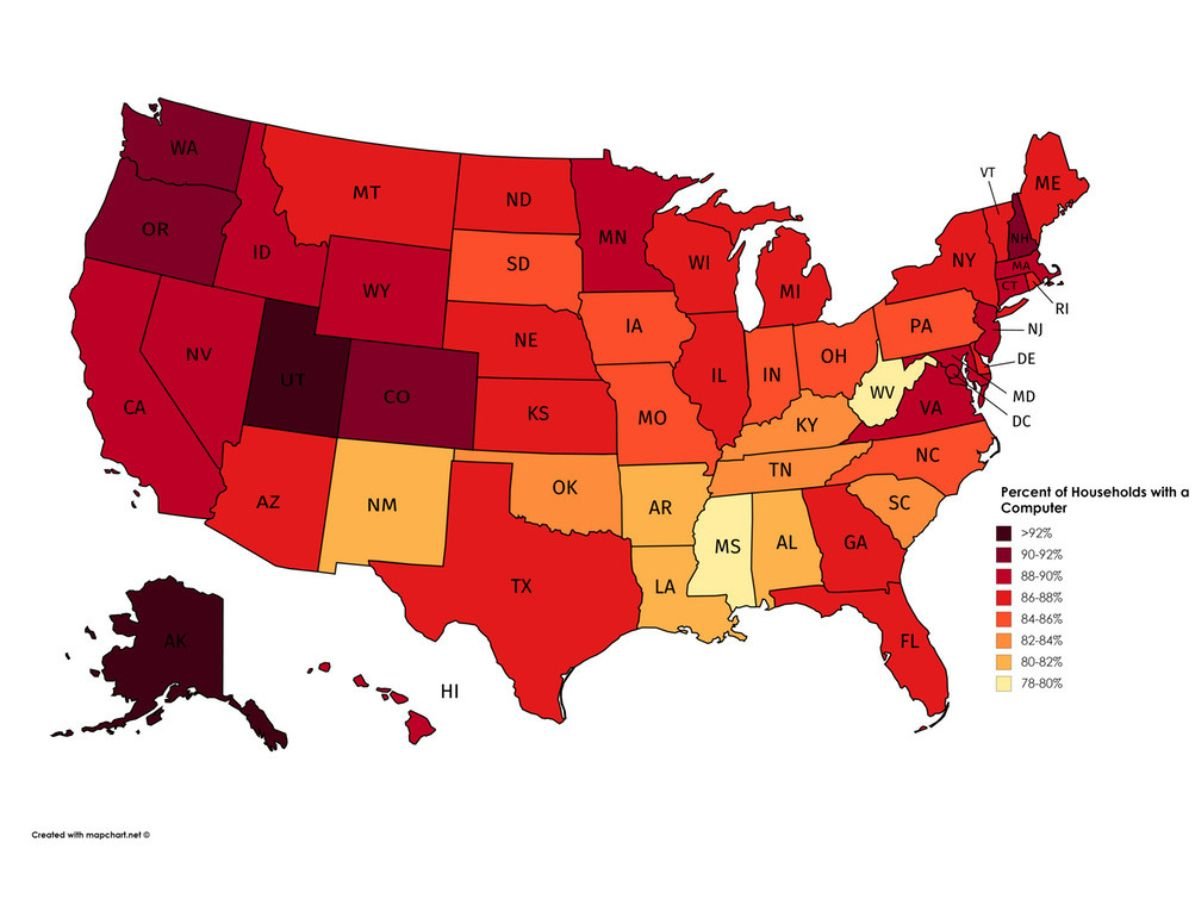
As technology becomes a part of our daily lives more and more, it is increasingly important to own a device. Over 92% of the households in the darkest red states, Utah and Alaska, own a computer. Meanwhile, in the palest yellow states, between 78-80% of households own a computer.
Source: Vivid Maps
It’s impressive that no matter what state you’re in, at least 78% of households own a computer. Technology really is innovating and changing every day! Charles Babbage, the inventor of the computer, would be proud.
Exports Galore
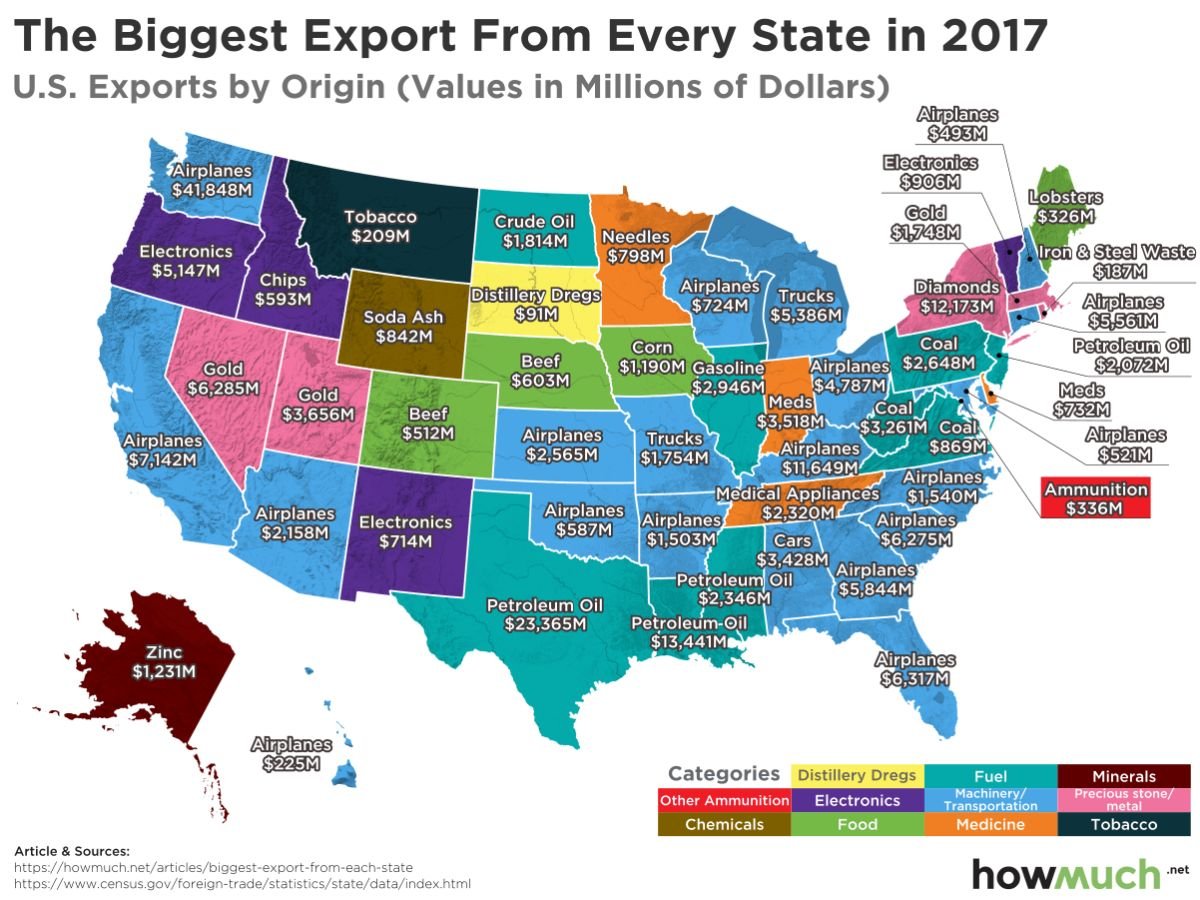
Have you ever wondered what each state exports the most? This map displays just that. With many states manufacturing airplanes the most, there are a few other categories such as food, medicine, and fuel. A large part of the U.S. economy relies on exports, so states are always working on developing their successful industries.
Source: Map created by Howmuch.net, a financial literacy website
Washington takes the cake for the most money brought in via exports. There is a wide variety of types of exports, creating a very colorful map.
It’s all About the Money
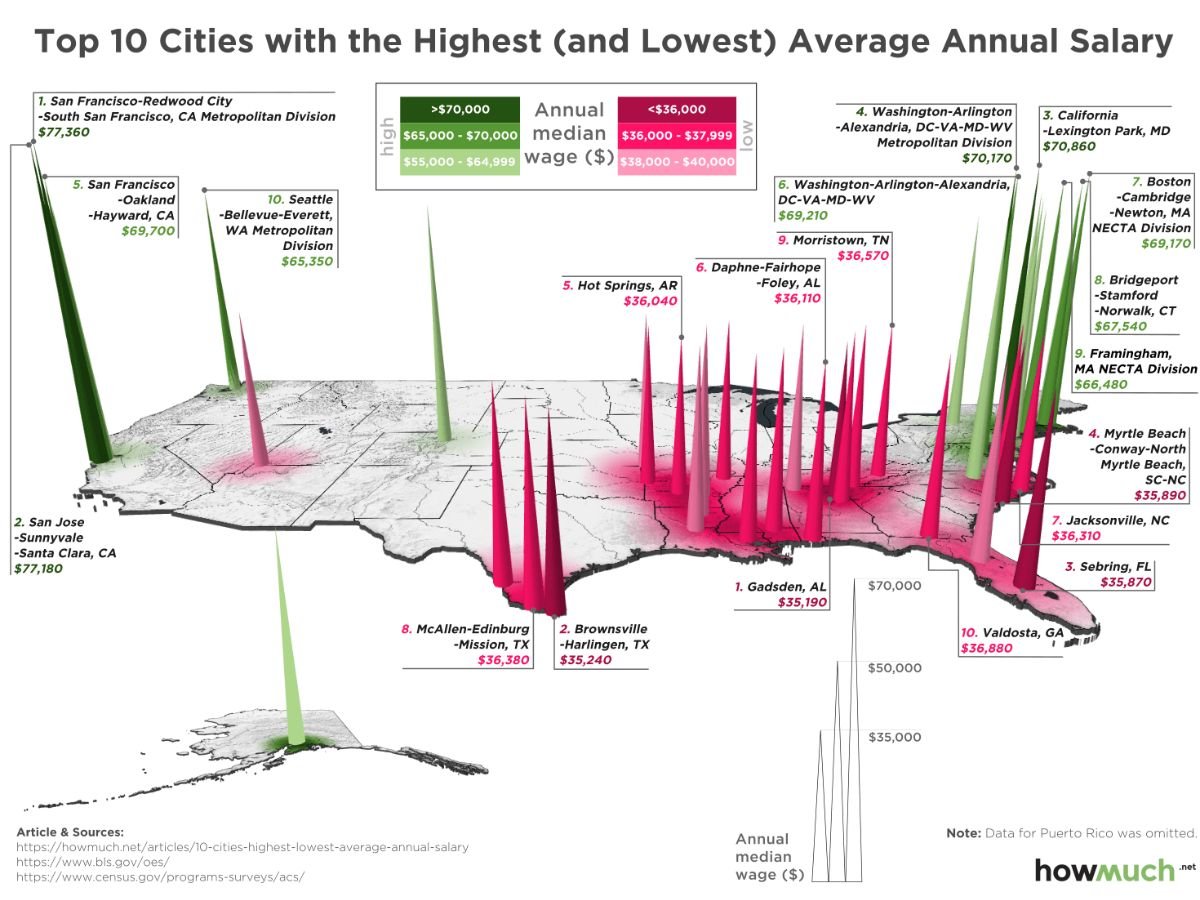
A person’s salary can heavily shape their level of well-being and satisfaction. People want to feel accurately compensated for the hard work that they put in. This map shows the cities with the highest and lowest average annual salary in the United States. The cities with the highest incomes are characterized with green spikes, while the cities with the lowest incomes are differentiated by red spikes.
Source: Map created by Howmuch.net, a financial literacy website
The overall economy benefits when people have higher salaries, as it stimulates more consumer spending when people feel financially stable. If you’re looking to make money, head to San Francisco, CA, and stay away from Gadsden, AL. San Francisco even has an incredibly low unemployment rate!
40. The End
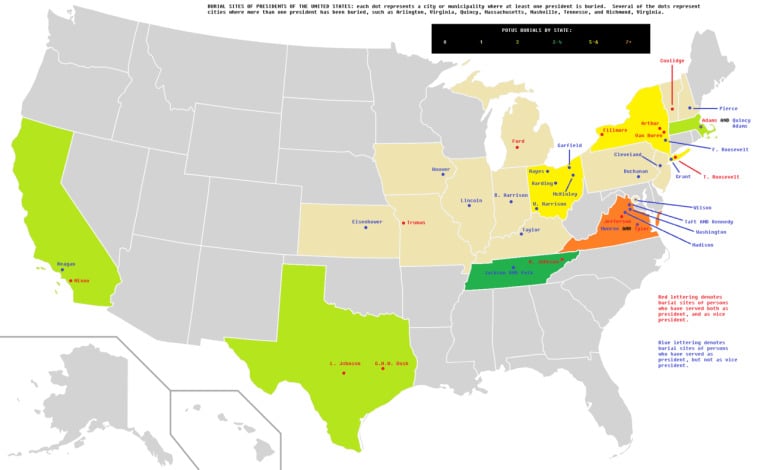
The end of life is the beginning of something new. If we can, we must be the ones who decide on our final resting places. If not, we must trust our family that they will give us a proper burial and a great place to rest.
MinnesotanUser via Wikipedia
Most of the presidents are buried in the Arlington National Cemetery, a military cemetery in Washington DC which is also the resting place of many soldiers who offered their lives to the country. Some presidents chose to be buried in their hometowns, including George W. Bush who was laid to rest at the George Bush Presidential Library in Texas. Wherever they now reside, they certainly won’t be forgotten.
